
Fichier:GW170608 spectrograms.png

Taille de cet aperçu : 597 × 600 pixels. Autres résolutions : 239 × 240 pixels | 478 × 480 pixels | 765 × 768 pixels | 1 019 × 1 024 pixels | 2 039 × 2 048 pixels | 4 050 × 4 068 pixels.
Fichier d’origine (4 050 × 4 068 pixels, taille du fichier : 866 kio, type MIME : image/png)
Ce fichier et sa description proviennent de Wikimedia Commons.
Description
| Description |
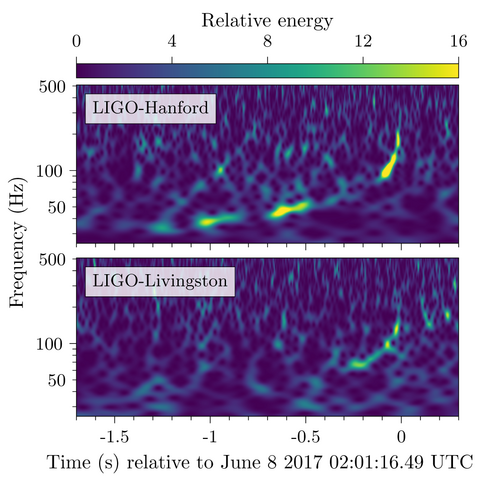
English: Energy in LIGO data as a function of time in seconds along the X axis and frequency in Hertz along the Y axis. The colors indicate the amount of energy at any given time/frequency, going from blue (low) to yellow (high). The curve from the lower left to the upper right, clearly visible in the Hanford data and hinted at in the Livingston data, is the gravitational wave signal from the black hole inspiral. |
| Date | |
| Source | https://www.ligo.org/science/Publication-GW170608/index.php (image link) |
| Auteur | LIGO Scientific Collaboration and Virgo Collaboration |
Conditions d’utilisation
Ce fichier est sous la licence Creative Commons Attribution – Partage dans les Mêmes Conditions 4.0 International.
- Vous êtes libre :
- de partager – de copier, distribuer et transmettre cette œuvre
- d’adapter – de modifier cette œuvre
- Sous les conditions suivantes :
- paternité – Vous devez donner les informations appropriées concernant l'auteur, fournir un lien vers la licence et indiquer si des modifications ont été faites. Vous pouvez faire cela par tout moyen raisonnable, mais en aucune façon suggérant que l’auteur vous soutient ou approuve l’utilisation que vous en faites.
- partage à l’identique – Si vous modifiez, transformez, ou vous basez sur cette œuvre, vous devez distribuer votre contribution sous la même licence ou une licence compatible avec celle de l’original.
Historique du fichier
Cliquer sur une date et heure pour voir le fichier tel qu'il était à ce moment-là.
| Date et heure | Vignette | Dimensions | Utilisateur | Commentaire | |
|---|---|---|---|---|---|
| actuel | 26 novembre 2017 à 11:42 | | 4 050 × 4 068 (866 kio) | Earthandmoon | User created page with UploadWizard |
Utilisation du fichier
Les 2 pages suivantes utilisent ce fichier :
Usage global du fichier
Les autres wikis suivants utilisent ce fichier :